ATR (Average True Range) measures how much price typically moves per bar. This alert fires when ATR roughly doubles compared to 20 bars ago, meaning the market just got a lot more active than its recent normal. It is a heads-up that the character of the market has changed.
In plain terms
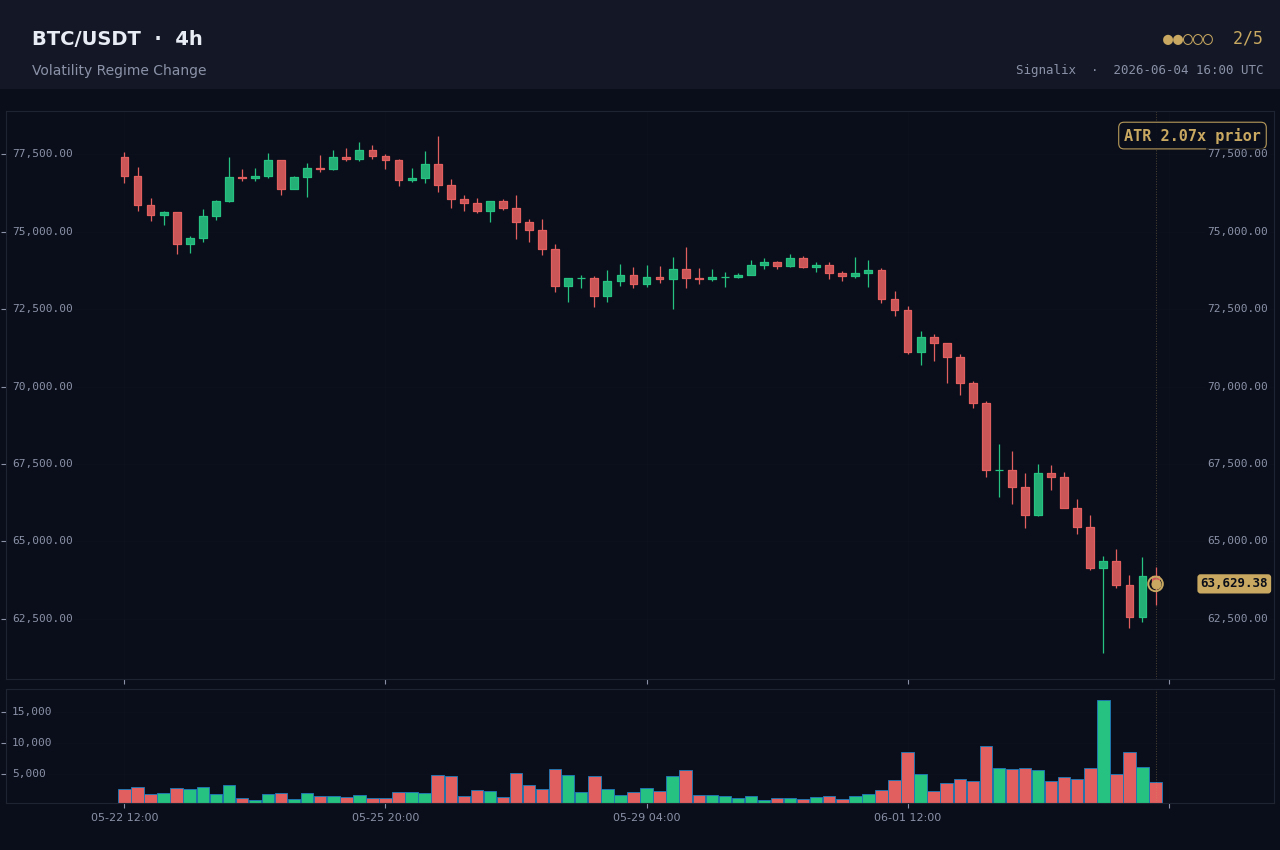
Candles just got much bigger than they have been. The calm period is over and price is moving with more energy now.
What triggers it
The latest ATR (over 14 bars) must be more than double the ATR from 20 bars earlier. The direction is intentionally neutral: a jump in volatility does not, by itself, tell you which way price will go.
How Signalix scores strength
This is a 2 out of 5 informational alert. It tells you the market's behaviour just shifted, often right before a strong trend begins or just after a long quiet range finally breaks. Which direction it resolves into is a separate question that other signals answer.
How to use it
It is most valuable as context. When volatility expansion fires at the same time as a directional signal (a Break of Structure, an FVG tap, a breakout) on the same market and timeframe, that directional signal gains extra weight. On its own, read it as "this market just woke up, watch it".