Bollinger Bands wrap around price and widen when it is volatile, narrow when it is calm. A "squeeze" is when the bands pinch unusually tight, which means the market has gone quiet and is coiling. A squeeze almost always resolves into a bigger move; the "release" is the candle that finally breaks out of the coil.
In plain terms
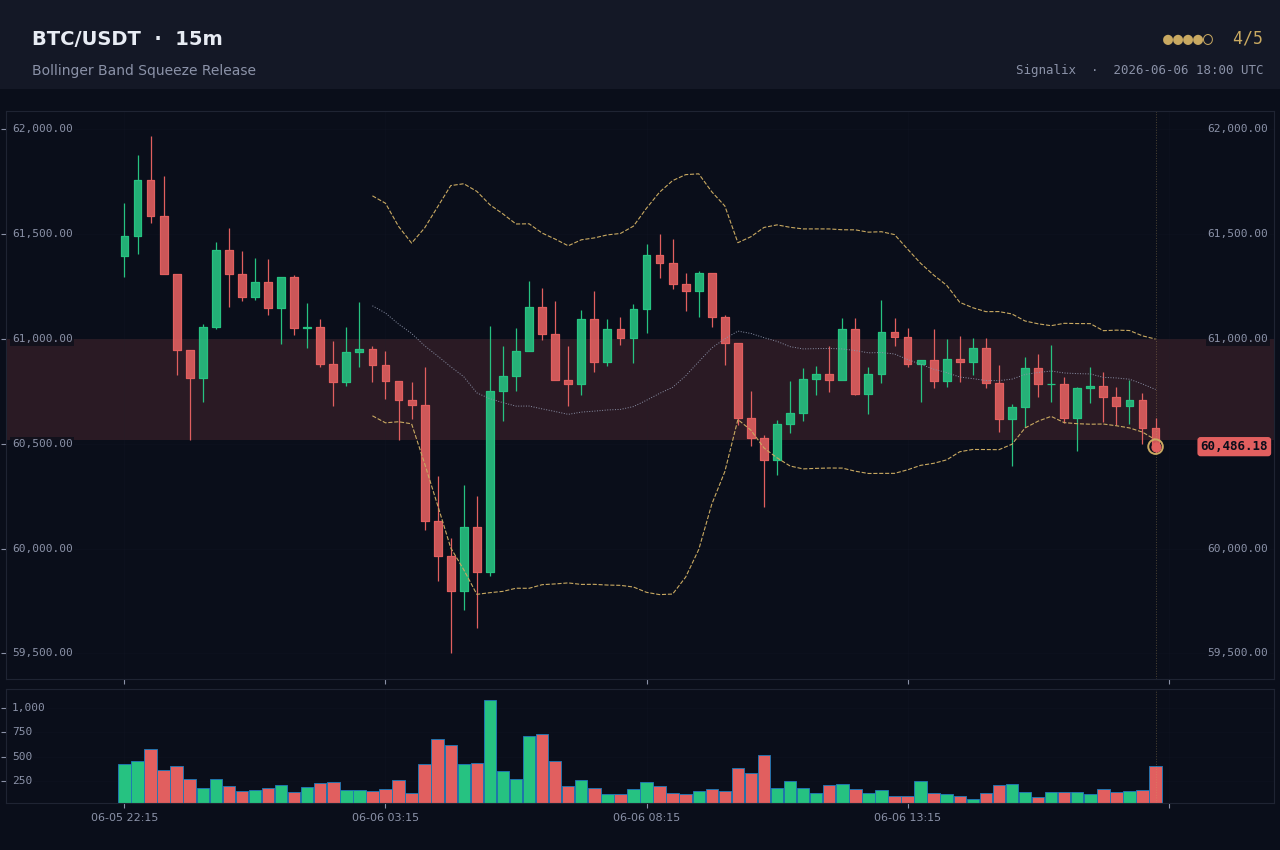
The market went quiet and compressed like a spring. This alert fires the moment the spring releases and price breaks out of the tight range.
What triggers it
Two phases must line up:
- Squeeze active: the band width has been in the tightest 20% of its recent range for at least 10 bars in a row.
- Release: the current candle closes above the upper band or below the lower band, and volume is more than 1.5x its 20-bar average.
How Signalix scores strength
The base score is 4 out of 5, because compressed volatility had to release somewhere and these moves tend to follow through. We add a point when the higher-timeframe trend agrees with the breakout direction.
One thing to remember
A squeeze can break either way. The direction of the release is the signal, and the alert only fires once price has actually closed beyond a band, not while it is still coiling.