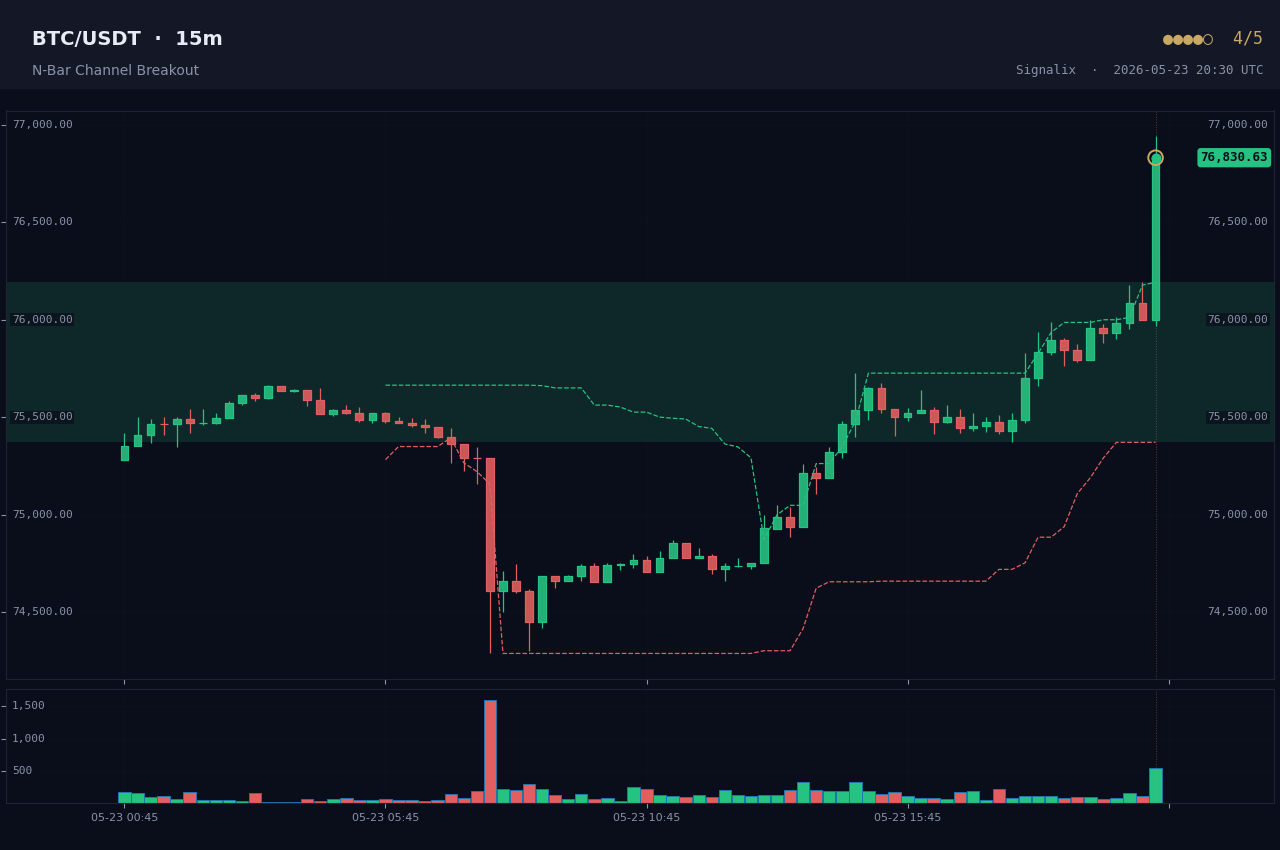
A Donchian channel simply tracks the highest high and lowest low over the last N bars. A breakout is when price closes beyond that recent extreme, meaning it just made a new high (or low) it has not seen in a while. Signalix uses N=20 and adds a volume check so it does not react to weak, low-participation pokes.
In plain terms
Price just closed above the highest point of the last 20 bars (or below the lowest), and it did so with real trading volume behind it. Something changed.
What triggers it
For a bullish breakout, the close must clear the highest high of the previous 20 bars. For bearish, it must drop below the lowest low. On top of that, the breakout bar's volume must be more than 1.5x its 20-bar average, so the move has genuine buying or selling participation behind it rather than a thin spike.
How Signalix scores strength
The base score is 3 out of 5. We add a point when the higher-timeframe trend agrees, and another when the breakout is large (more than 2x the ATR), the kind of expansion that historically keeps going rather than fizzling out.
What it is not
It is not a buy or sell instruction. A channel break is one ingredient of a setup. Read it alongside the bigger trend and nearby key levels rather than on its own.