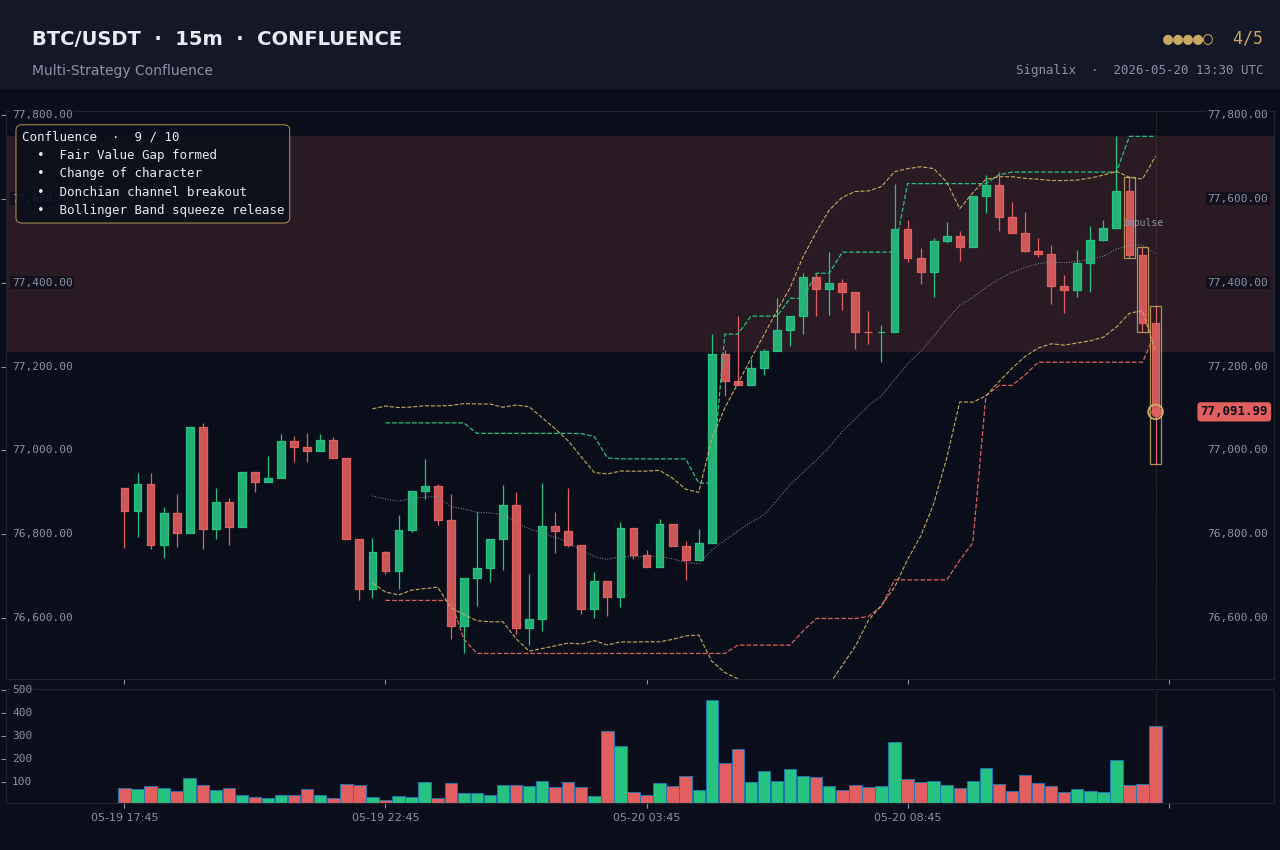
This is Signalix's flagship alert. "Confluence" means several independent signals pointing the same way at the same time. It fires only when at least 3 different detectors agree on direction within the same scan, and their combined weighted score reaches 6 or higher.
In plain terms
One signal can be random noise. Three separate, unrelated reasons all lining up in the same direction at the same moment is much harder to dismiss. That stack of agreement is what this alert captures.
How the score is built
Not every signal counts equally. Each contributor carries a weight based on how much conviction it historically holds:
- Change of Character, liquidity sweep: 3 points each
- FVG tap, order block tap, Donchian, BB squeeze, regular RSI divergence, range breakout: 2 points each
- Break of Structure, level test, volume spike, volatility expansion, hidden RSI divergence: 1 point each
- Higher-timeframe alignment: +1 bonus when any contributor's bigger trend matches the agreed direction
How Signalix scores strength
The weighted total maps onto the strength dots: a score of 6 to 7 is 3 out of 5, 8 to 9 is 4 out of 5, and 10 or more is the full 5 out of 5.
How to read the chart
The confluence chart draws one merged zone (the combined area of all the contributors) with each individual contributor's zone stacked underneath. The Telegram caption lists every aligned pattern by name so you can see exactly what stacked up.