RSI is a momentum gauge that runs from 0 to 100. A regular bullish divergence happens when price makes a lower low (it looks weaker) but the RSI makes a higher low (momentum is actually improving). The two disagree, and that disagreement often comes before a bounce.
In plain terms
Price is still falling, but the selling is running out of steam under the surface. That mismatch is an early hint that a turn upward may be near.
What triggers it
Signalix takes the two most recent confirmed swing lows in price and
compares them with the RSI at those same two points. Both must be true:
price's second low is lower than its first (price[L2] < price[L1])
while RSI's second low is higher than its first (RSI[L2] > RSI[L1]). We
also require the latest RSI to be below 35 so the signal lands in a
genuinely oversold area, not in the middle of nowhere.
How Signalix scores strength
The base score is 3 out of 5. We add a point when the two swing lows are 10 to 30 bars apart (the classic, reliable spacing for divergence) and another point when RSI at the latest low is deeply oversold (below 25).
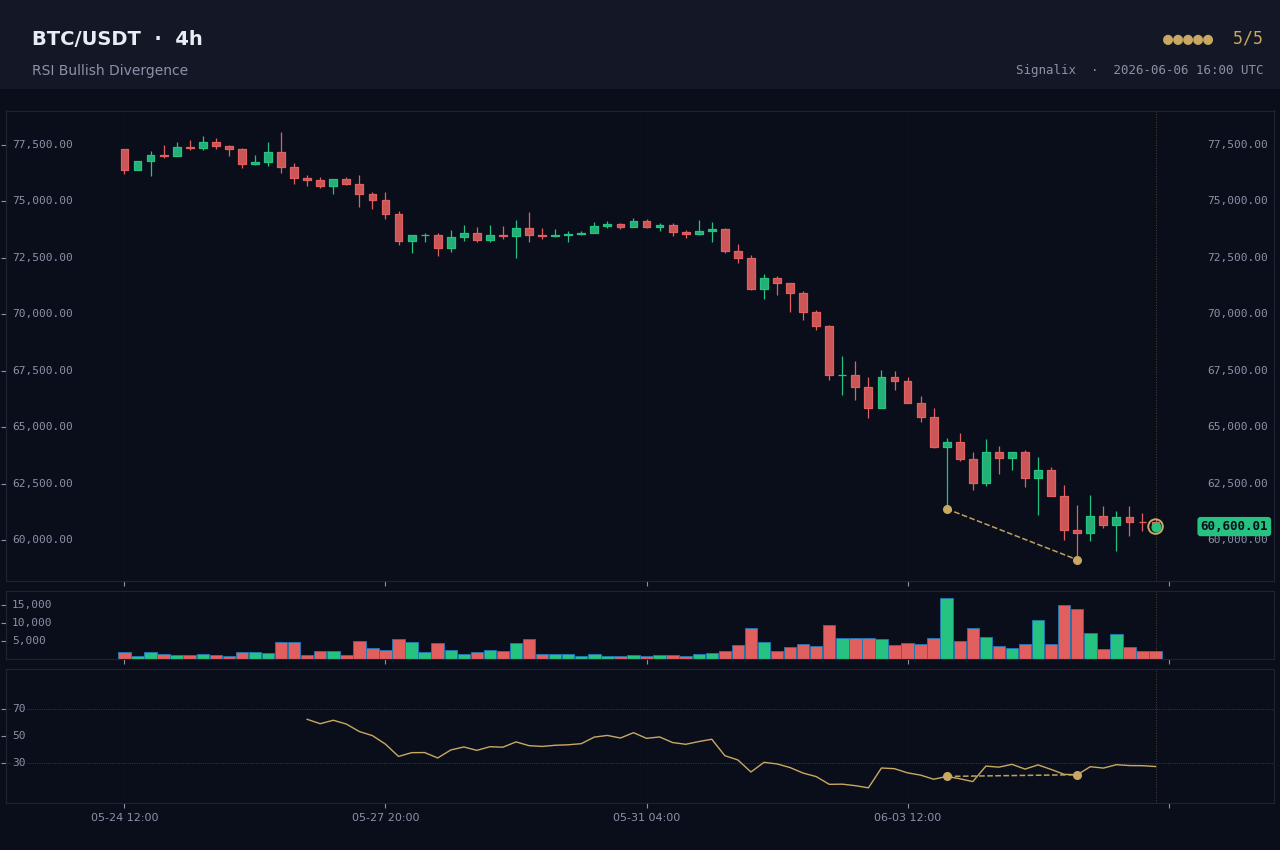
How to read the chart
The current candle is the freshly-confirmed second low. The alert detail shows both price lows and both RSI values so you can check the geometry for yourself.