Some horizontal price levels get touched again and again. A key level test fires when price comes back to a level that has already been touched at least 3 times in the last 200 bars. Levels like that tend to act as support (a floor) or resistance (a ceiling), so traders watch how price behaves when it returns.
In plain terms
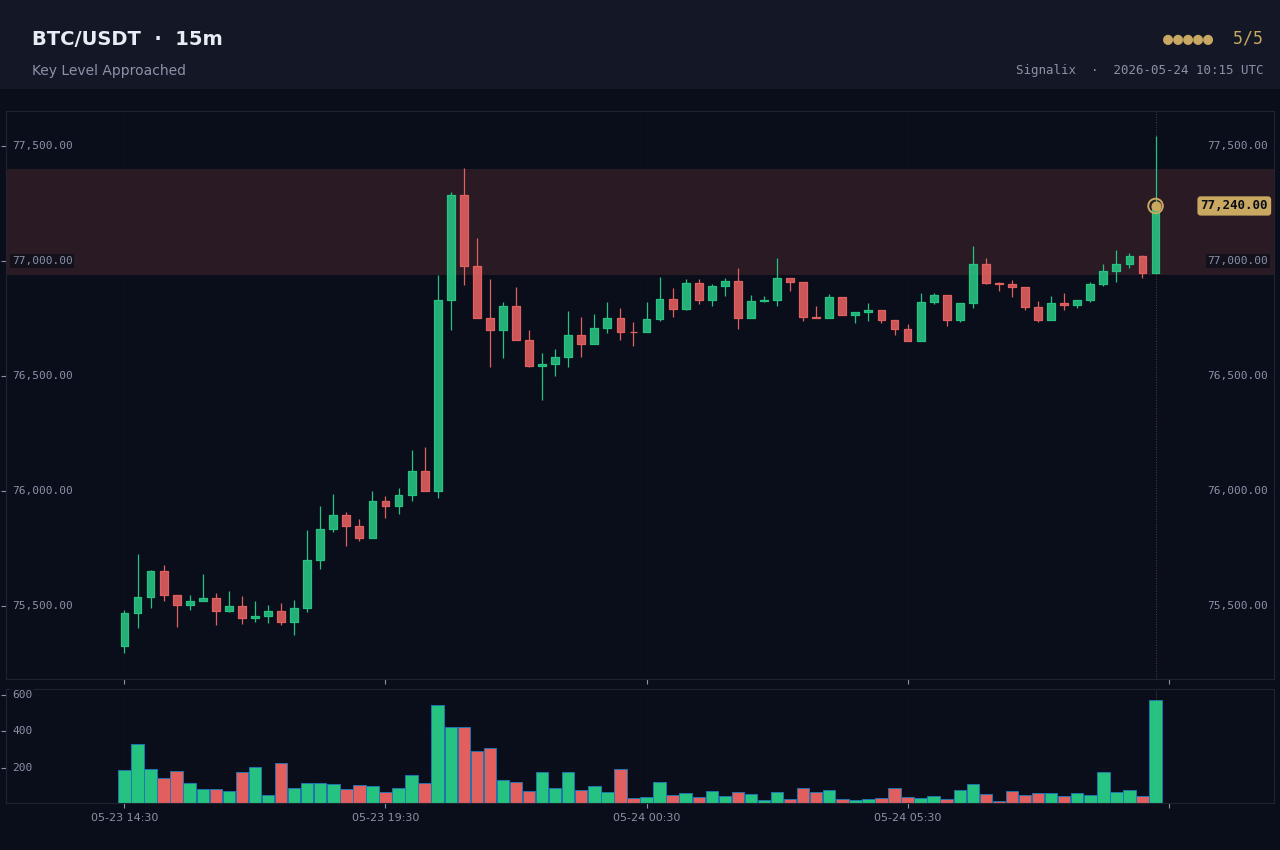
Price is back at a line it has bounced off several times before. Those repeat lines matter, so this is a moment to watch closely.
What triggers it
Signalix groups together swing highs and lows from the last 200 bars that sit within 0.3% of each other. The group with the most touches defines the key level. The alert fires when the current close sits within 0.3% of that level.
How Signalix scores strength
The base score is 3 out of 5. We add a point for every extra touch beyond the minimum of 3, so a level that has been respected 5 times scores the full 5 out of 5. More touches means a more proven level.
Which way it points
The direction is neutral on purpose. The same level can act as a floor or a ceiling depending on which side price is coming from. The alert detail includes an "approach side" field so you can see whether price is testing the level from above or below.