A Break of Structure confirms that an existing trend is still going. In an uptrend (a series of higher highs and higher lows), a BOS is when price closes above the most recent peak, proving buyers are still in control. In a downtrend it is the mirror: a close below the most recent low.
In plain terms
The trend just made a new step in the same direction. It is a "trend-continues" signal, not a "trend-reverses" one.
Continuation, not reversal
A BOS pushes the trend forward by taking out the latest pivot in the trend's own direction. Its opposite is the CHoCH (Change of Character), which breaks a pivot against the trend and hints at a possible reversal. Same idea, opposite meaning.
How Signalix scores strength
The base score is 2 out of 5. Continuation signals carry less weight than reversals because the move is "more of the same" rather than something new. We add a point when the higher-timeframe trend agrees with the direction of the break.
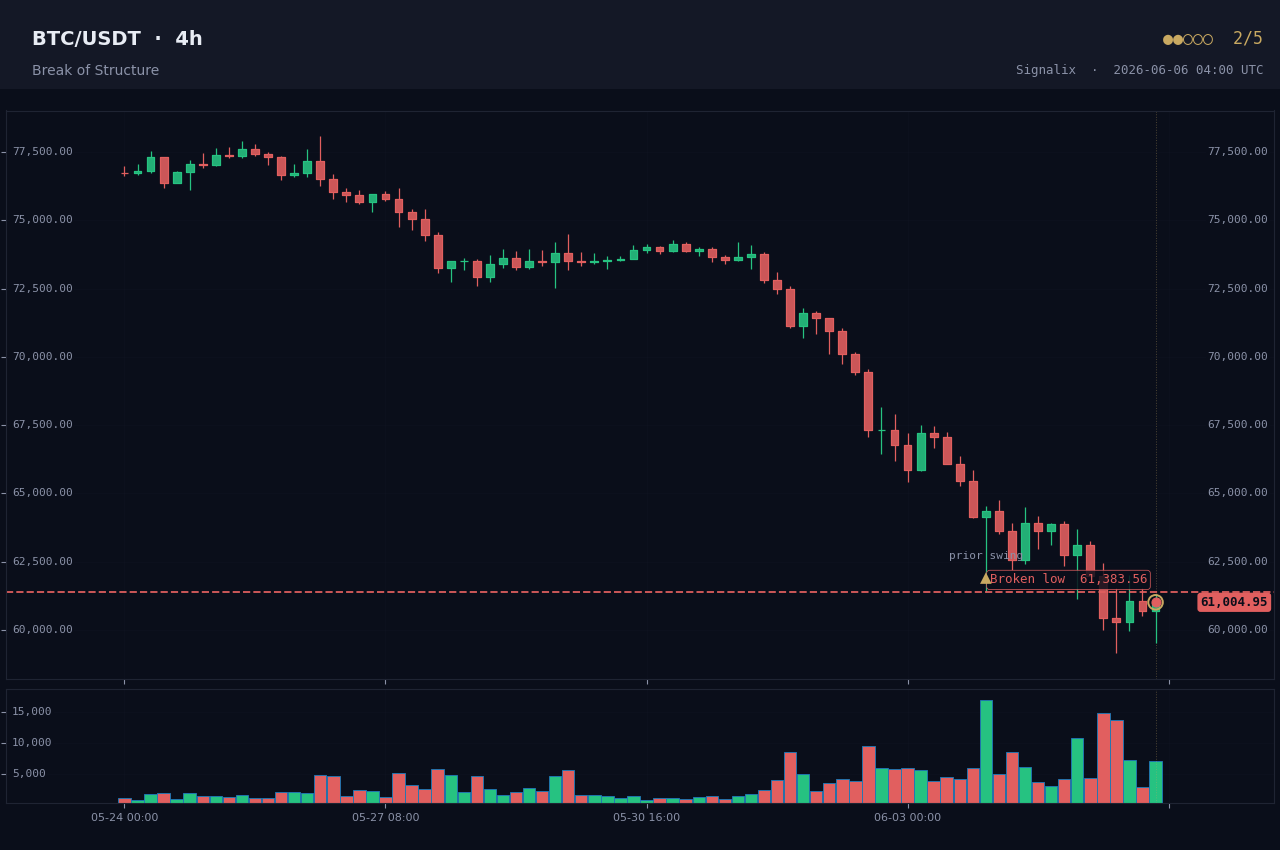
How to read the chart
The marked level is the swing high or low that price broke through. The highlighted trigger candle is the bar whose close pierced that level in the trend's direction.