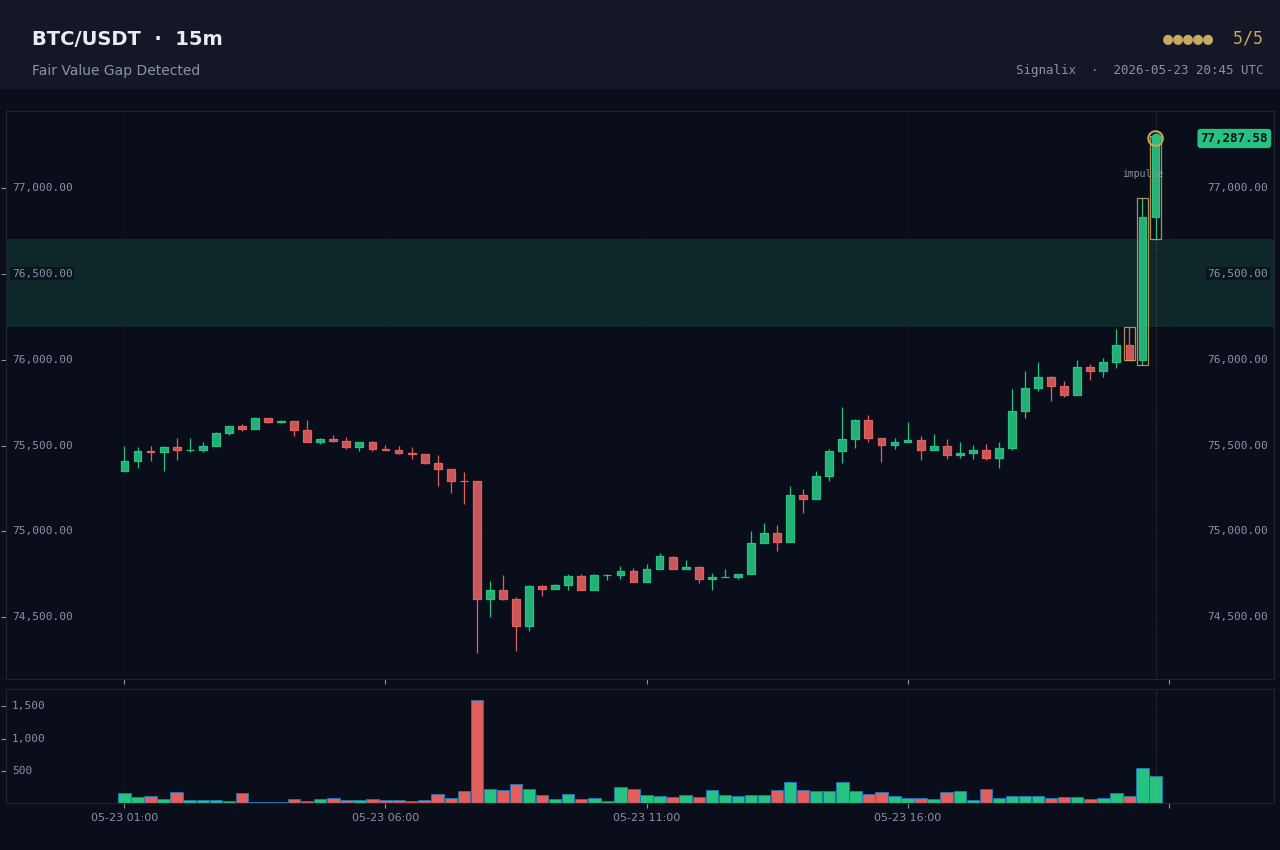
A Fair Value Gap is a small "hole" left on the chart when price moves so fast in one direction that it skips over a range of prices without trading there properly. It takes three candles to form: a strong middle candle pushes hard, and the wicks of the candle before it and the candle after it never overlap. That untouched space in between is the gap.
In plain terms
Price ran away too quickly and left a gap behind. Markets tend to drift back to "fill" that gap later, which is why these zones are worth watching.
What forms it
A bullish FVG forms when the low of the latest candle stays above the
high of the candle two bars back (low[i] > high[i-2]), with a strong
up-move in the middle. The gap zone is the space between those two
levels. A bearish FVG is the exact mirror after a strong down-move.
How Signalix scores strength
We compare the size of the gap to recent volatility (the ATR over 14 bars). A gap that is tiny relative to normal movement is a weak imbalance and scores low. A large gap that also lines up with the higher-timeframe trend is the strongest case and can reach 5 out of 5.
How to read the chart
The shaded band is the unfilled gap, coloured for its direction. The strength dots show how significant the gap is compared to recent price movement. They describe the setup; they are not a promise that price will return to fill it.