Once a Fair Value Gap has formed (see the FVG entry), price often comes back to revisit that gap before continuing on its way. The moment price first re-enters the gap is called a "tap". This alert fires on the exact candle whose wick first touches back into a gap that has not been filled yet.
In plain terms
Price left a gap earlier, and now it has come back to test it. This is the moment traders watch to see whether the zone holds or breaks.
Why it matters
A gap acts like a magnet because unfinished business (resting orders) sits on both sides of it. When price taps the zone it either reacts and turns away, or pushes straight through. Signalix does not predict which; it flags the tap and then records what actually happened afterwards so you can study the history.
How Signalix scores strength
The base score is 3 out of 5. We add a point when the higher-timeframe trend points the same way as the gap, and another point when the gap is fresh (formed within the last 20 bars). Older gaps that no longer match the bigger trend score lower because their edge has faded.
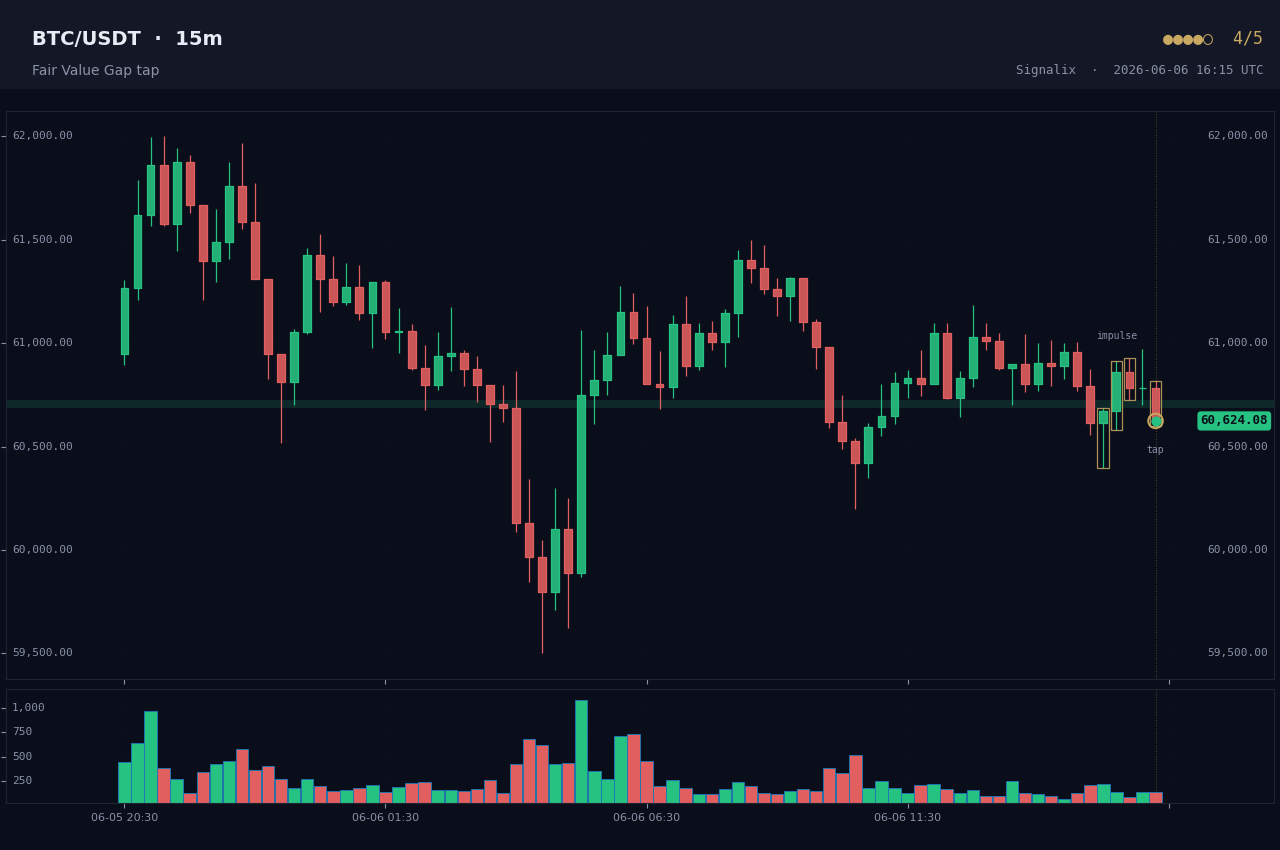
How to read the chart
The shaded band is the original gap zone. The highlighted trigger candle is the one whose wick re-entered that band for the first time since the gap formed.