A liquidity sweep is when price briefly spikes past a row of roughly equal highs or equal lows, then snaps back inside on the same candle. Those equal levels are where many traders place their stop-loss orders. A sweep suggests price reached up (or down) just far enough to trigger those stops, then reversed, meaning the spike was a "stop hunt" rather than a real breakout.
In plain terms
Price faked a breakout, grabbed the stops resting above or below, then turned around. The fake-out direction is usually the wrong way, so the alert points the opposite way.
What triggers it
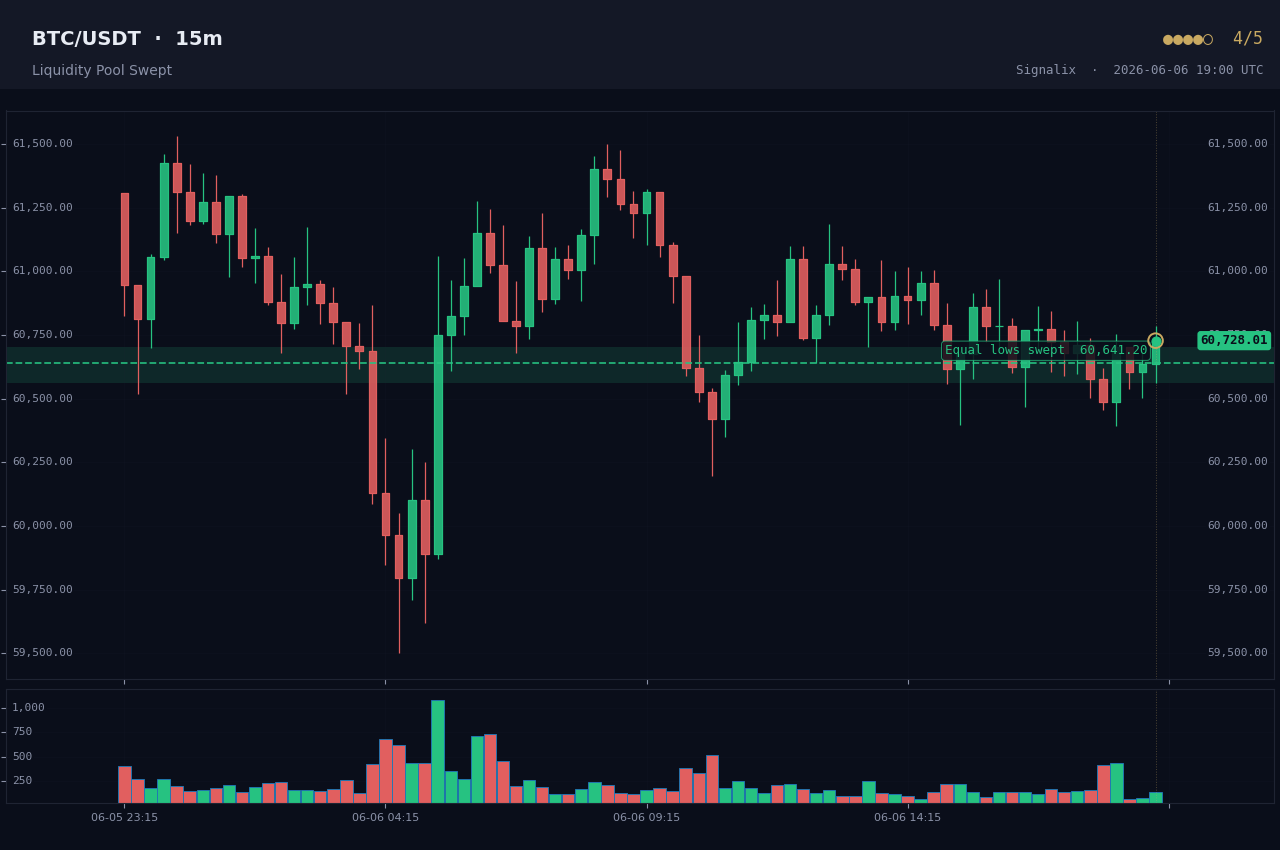
Signalix first finds at least two swing points sitting within 0.1% of each other (the equal-level cluster). The alert fires on the candle whose wick pokes past that cluster but whose close lands back inside it. The signal direction is opposite to the sweep.
How Signalix scores strength
The base score is 4 out of 5, because the close-back-inside is strong evidence on its own that the breakout failed. We add a point when the higher-timeframe trend agrees with the resulting direction.
Which way it points
A sweep above equal highs points bearish (price rejected the highs). A sweep below equal lows points bullish (price rejected the lows).